CausaDB Quickstart
![]()
This is a simple notebook to help you get started with CausaDB in Python. For more information, visit the CausaDB docs. In this notebook we'll give a broad overview and whistle-stop tour of some of the core features of CausaDB. This notebook isn't intended to be a full guide. For that, please refer to the documentation.
Initialise a client
Before you can use CausaDB, you need to create a client. You can do this by providing your token key. We'll load from Google colab secrets in this example, but in production the token could be loaded from environment variables or a secret manager. In this example you can replace <YOUR_TOKEN> with your token.
from causadb import CausaDB
from causadb.plotting import plot_causal_graph, plot_causal_attributions
import numpy as np

client = CausaDB(token="<YOUR_TOKEN>")
Registering a data source
CausaDB works by first registering data with the cloud service, and then attaching it to your model. Data can be loaded from a live database or a file. Loading from a database is preferred because it avoids duplication and keeps a single source of truth, but sometimes it will be necessary to load from a local file like a .csv or .xlsx, or even a Python pandas dataframe.
In this example we'll show how to load data from a pandas dataframe. The data we'll use are from one of the built-in example datasets that are included in the CausaDB Python library.
from causadb.examples.heating import get_heating_dataset, set_heating
data = get_heating_dataset()

client \
  .add_data("quickstart-heating-data") \
  .from_pandas(data)

data.head()
| day | outdoor_temp | heating | indoor_temp | energy | |
|---|---|---|---|---|---|
| 0 | 0 | 14.73 | 55.0 | 17.80 | 673.0 |
| 1 | 1 | 12.07 | 61.0 | 20.47 | 729.0 |
| 2 | 2 | 14.30 | 58.0 | 19.47 | 703.0 |
| 3 | 3 | 15.27 | 51.0 | 17.49 | 649.0 |
| 4 | 4 | 15.18 | 53.0 | 18.73 | 650.0 |
Defining a causal model
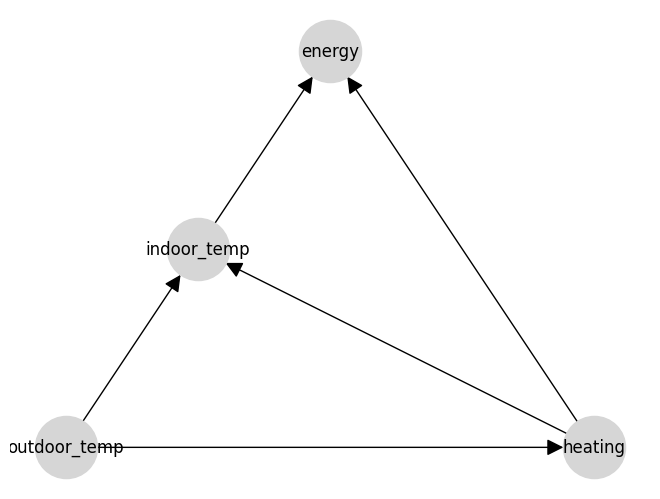
The code below creates a causal model and defines its causal structure. This can be done through code, as below, or through our BETA model builder web interface. In the first two lines of set_edges, for example, we're saying that the outdoor temperature might effect both the indoor temperature and the heating setting. This allows the model to learn any relationship between those variables when it is trained.
For information on defining the causal structure structure see Model Structure Concepts
# Define a causal model (can also be done in the UI)
model = client.create_model("quickstart-heating-model")
model.set_nodes(["outdoor_temp", "heating", "indoor_temp", "energy"])
model.set_edges([
    ("outdoor_temp", "heating"),
    ("outdoor_temp", "indoor_temp"),
    ("heating", "indoor_temp"),
    ("heating", "energy"),
    ("indoor_temp", "energy")
])
Visualising the model
We can see what this causal model looks like for manual checking by visualising it using CausaDB's built-in plotting tools.
plot_causal_graph(model)
Training a causal model
Now we can train the model on the loaded data. This will learn the causal relationships according to the structure defined above. This model will then be ready to query.
model.train("quickstart-heating-data")
Simulating actions
One of the common use cases unique to causal models is to simulate the effect of actions to see how they change the outcome. We can do this by setting the value of a variable to a specific value, and then seeing how the other variables change. This is useful for understanding the impact of actions/decisions/interventions, or for making predictions.
CausaDB is fully Bayesian. This has the advantage of allowing easily access the lower and upper bounds of the predictions as well as the expected (average) value, using the lower, upper, and median keys.
model.simulate_actions(actions={
  "heating": [46, 54],
  "outdoor_temp": [12, 14]
})["median"]
| day | outdoor_temp | heating | indoor_temp | energy | |
|---|---|---|---|---|---|
| 0 | 0.0 | 12.0 | 46.0 | 16.533552 | 599.737037 |
| 1 | 0.0 | 14.0 | 54.0 | 18.653116 | 668.615622 |
It also works for single values, shown below using the lower key for demonstration.
model.simulate_actions(actions={
  "heating": 46,
  "outdoor_temp": 12
})["lower"]
| day | outdoor_temp | heating | indoor_temp | energy | |
|---|---|---|---|---|---|
| 0 | 0.0 | 12.0 | 46.0 | 15.687185 | 593.513125 |
Finding the best action(s) to take
Probably the most common use case is to find the best action to take. This could be a decision, an optimisation, or a recommendation. We can do this using the find_best_action method, which will find the action that achieves an outcome closest to a target value. This can be done while respecting constraints on other variables, or by setting the value of other variables to specific values using the fixed parameter.
best_actions = model.find_best_actions(
    targets={"indoor_temp": 19},
    actionable=["heating"],
    fixed={"outdoor_temp": 16}
)

achieved_indoor_temp = set_heating(best_actions["heating"].values, np.array([16]), noise=False)[0]

print(f"Best heating setting: {best_actions['heating'].values[0]:.1f}")
print(f"Indoor temperature achieved: {achieved_indoor_temp[0]:.1f}°C")
Best heating setting: 54.3
Indoor temperature achieved: 19.0°C
Finding the causal effects of a variable
Another useful query is to find the causal effect of a variable on the others. This can be done using the causal_effect method, which will return the expected change in the target variable for a given change in the causal variable. This can be done for a range of values, or for a single value.
model.causal_effects({"heating": [50, 55]}, fixed={"outdoor_temp": 15})
| median | lower | upper | |
|---|---|---|---|
| day | 0.000000 | 0.000000 | 0.000000 |
| outdoor_temp | 0.000000 | 0.000000 | 0.000000 |
| heating | 5.000000 | 5.000000 | 5.000000 |
| indoor_temp | 1.295403 | 1.135942 | 1.454892 |
| energy | 43.059056 | 40.899418 | 45.263778 |
Attributing causes of an outcome
A similar but distinct query to causal_effects is causal_attributions, which calculates how much each variable contributes to the value of an outcome variable. This can be useful for understanding the importance of different variables in a system. It's important to interpret these results in the context of the model, as the causal pathways can sometimes be indirect (through another variable).
causal_attributions = model.causal_attributions("energy")
causal_attributions
| energy | |
|---|---|
| outdoor_temp | -25.130205 |
| heating | 8.639587 |
| indoor_temp | 2.948999 |
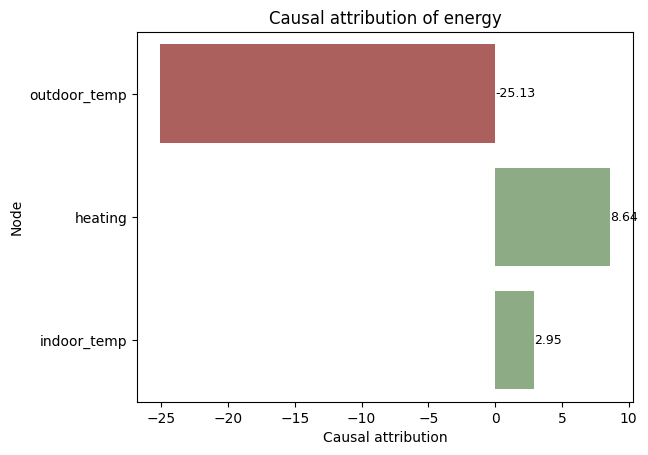
Causal attributions can also be plotted to visualise the impacts of various variables on the outcome. Positive-valued attributions mean that greater values of the cause node will positively affect the outcome node, and negative-valued attributions mean that greater values of the cause node will negatively affect the outcome node.
plot_causal_attributions(model, "energy", normalise=False)
There is also a normalised version of the function to show the relative importance of each variable, scaled to sum to 1.
plot_causal_attributions(model, "energy", normalise=True)
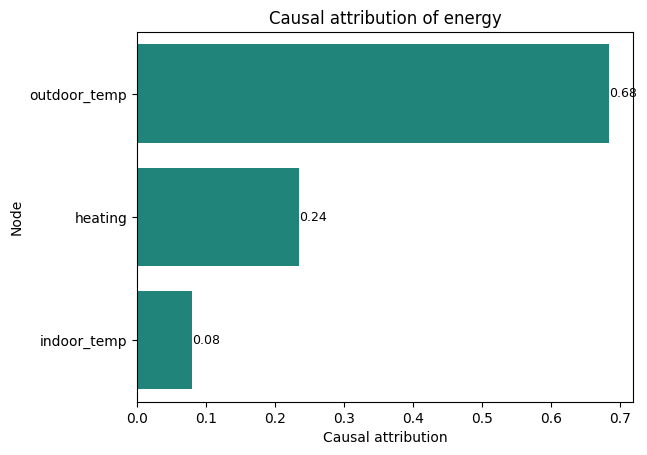
It's interesting to note that indoor temperature has a small effect on energy usage. This is because refrigeration units will work harder to maintain a lower temperature, and heating units will work harder to maintain a higher temperature. This is a good example of how causal models can capture these complex relationships.
Conclusion
This has been a quick overview of some of the core features of CausaDB. For more information, please refer to the documentation or get in touch with us via email: causadb@causa.tech or our Slack community.